AC06 CYCLING WAYS IN DISTRIBUTOR ROADS
Cycling routes and solutions on distributor roads, with level intersections
Aim
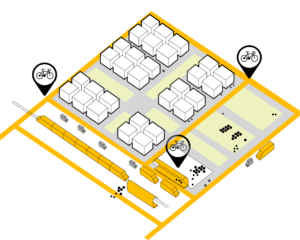
Create a bicycle ways network that should be: Safe, Direct, Cohesive, Attractive and Comfortable; the first three criteria being the most important.
Why?
Across Europe the increase in traffic in city centres leads to chronic congestion, with many negative consequences in terms of loss of time and damage to the environment, health and the economy. Every year, the European economy loses around one hundred thousand million euros, or 1% of the EU’s GDP. Urban traffic accounts for 40% of CO2 emissions and 70% of emissions of other pollutants from road transport. The risk of respiratory diseases has increased by around 50% among children living near arteries with heavy traffic (WHO 2000 data). The health cost of pollution caused by road transport in Spain is estimated at around 5000 million euros per year (TRUE Initiative).
However, recent studies in the UK show that the health benefits of cycling 3 days a week for one year can be as high as £670. From an analysis of 16 studies that analysed transport (infrastructure or policy) actions economically, and included data on bicycle use or walking, impressive data are obtained: the benefit/cost ratios were 5:1 on average.
How?
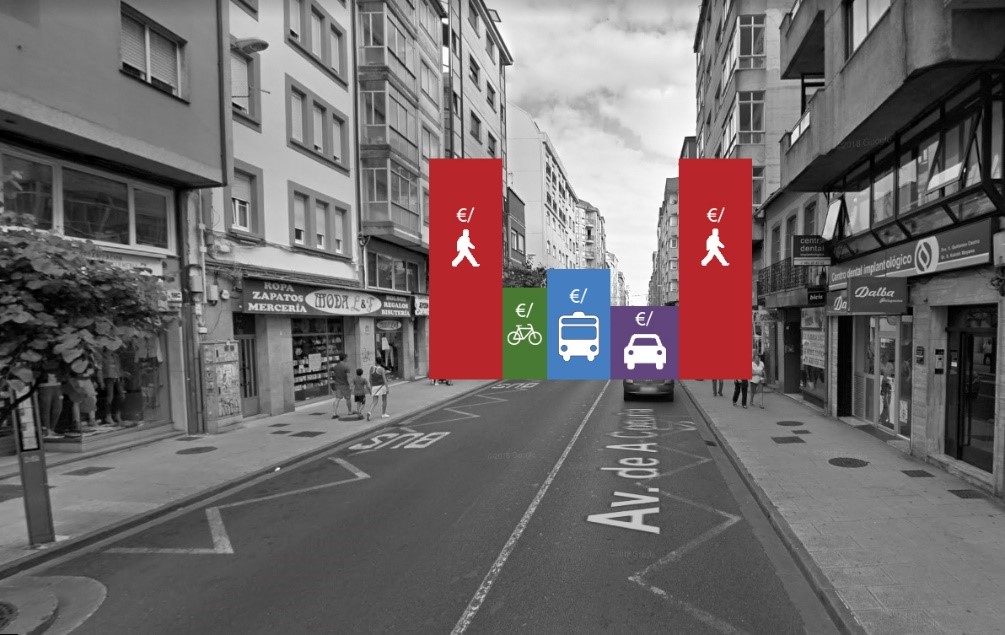
Depending on the city’s cycling development, one or the other of the above criteria must be emphasised.
Most cities in Spain (and Europe) are considered to be in a start-up phase, so the main emphasis should be on safety and encouraging people to use bicycles.
The main network will be that which links major nodes of trip attraction and should therefore have characteristics of capacity, priority and comfort superior to secondary. This main network will be made up of bicycle lanes protected by parking strips or services, or separated by kerb or lane separators. Except for justified exceptions, they shall be one-way and shall always have priority over cars in the absence of traffic lights. In new developments, when separate lanes are considered, it is recommended that they be placed at an intermediate level between carriageway and pavement.
The solutions along these itineraries may be different depending on the street on which they run, but the bicycle must always be given priority over cars and an attempt will be made to provide the bicycle lane with the greatest safety and separation.
On distribution routes, cycle paths will always be separated, although it is not compulsory for cycle routes to follow the same trace as the streets. In the event that the Main Network runs along access roads, it will not be essential to separate the traffic. On the other hand, the crossing of the main network through shared or pedestrian zones must be exceptional.
The secondary network connects secondary poles, or residential areas, generally coinciding with access or shared streets. It will also serve as a connection between main itineraries. It will not generally be necessary to separate the traffics as the speed will be limited to 10-20 km/h. If necessary, contraflow bike lanes will be provided on one-way roads to facilitate bicycle movement, versus car movement.
This urban network must be linked to leisure or sports itineraries outside the city centre.
Minimum design criteria will be used when proposing solutions. In any case, it is important to point out that sometimes it is better not to design anything than to design a solution that produces a false sense of security. Therefore, when proposing solutions, the safety criterion will always prevail.
In general, the recommendations of the latest edition of the Dutch cycleway design manual (CROW, 2016) will be followed. Only the following typologies are recommended, in order of priority:
• Unidirectional cycle path at different level/protected
• Bi-directional cycle path at different level/protected
• Solitary cycle path (completely separated with no relation to other roads or streets)
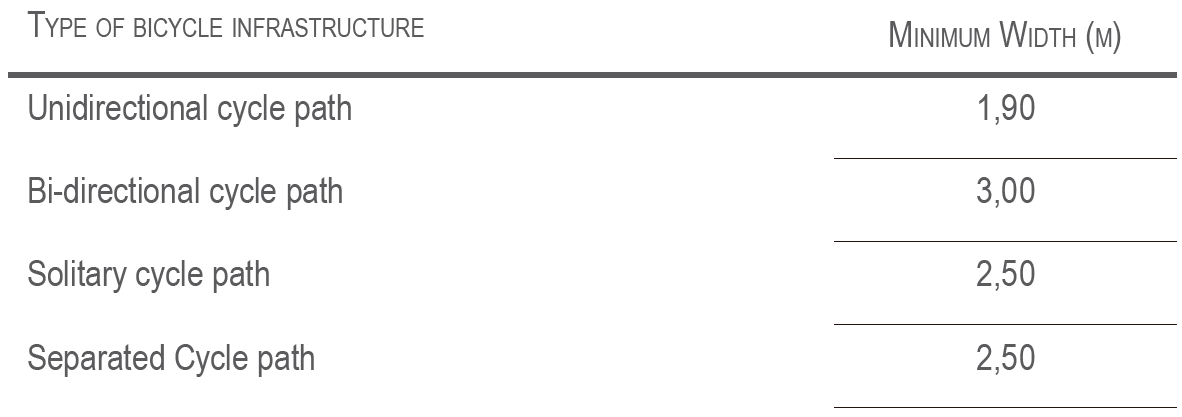
• Separated Cycle path (completely separated along trough roads)
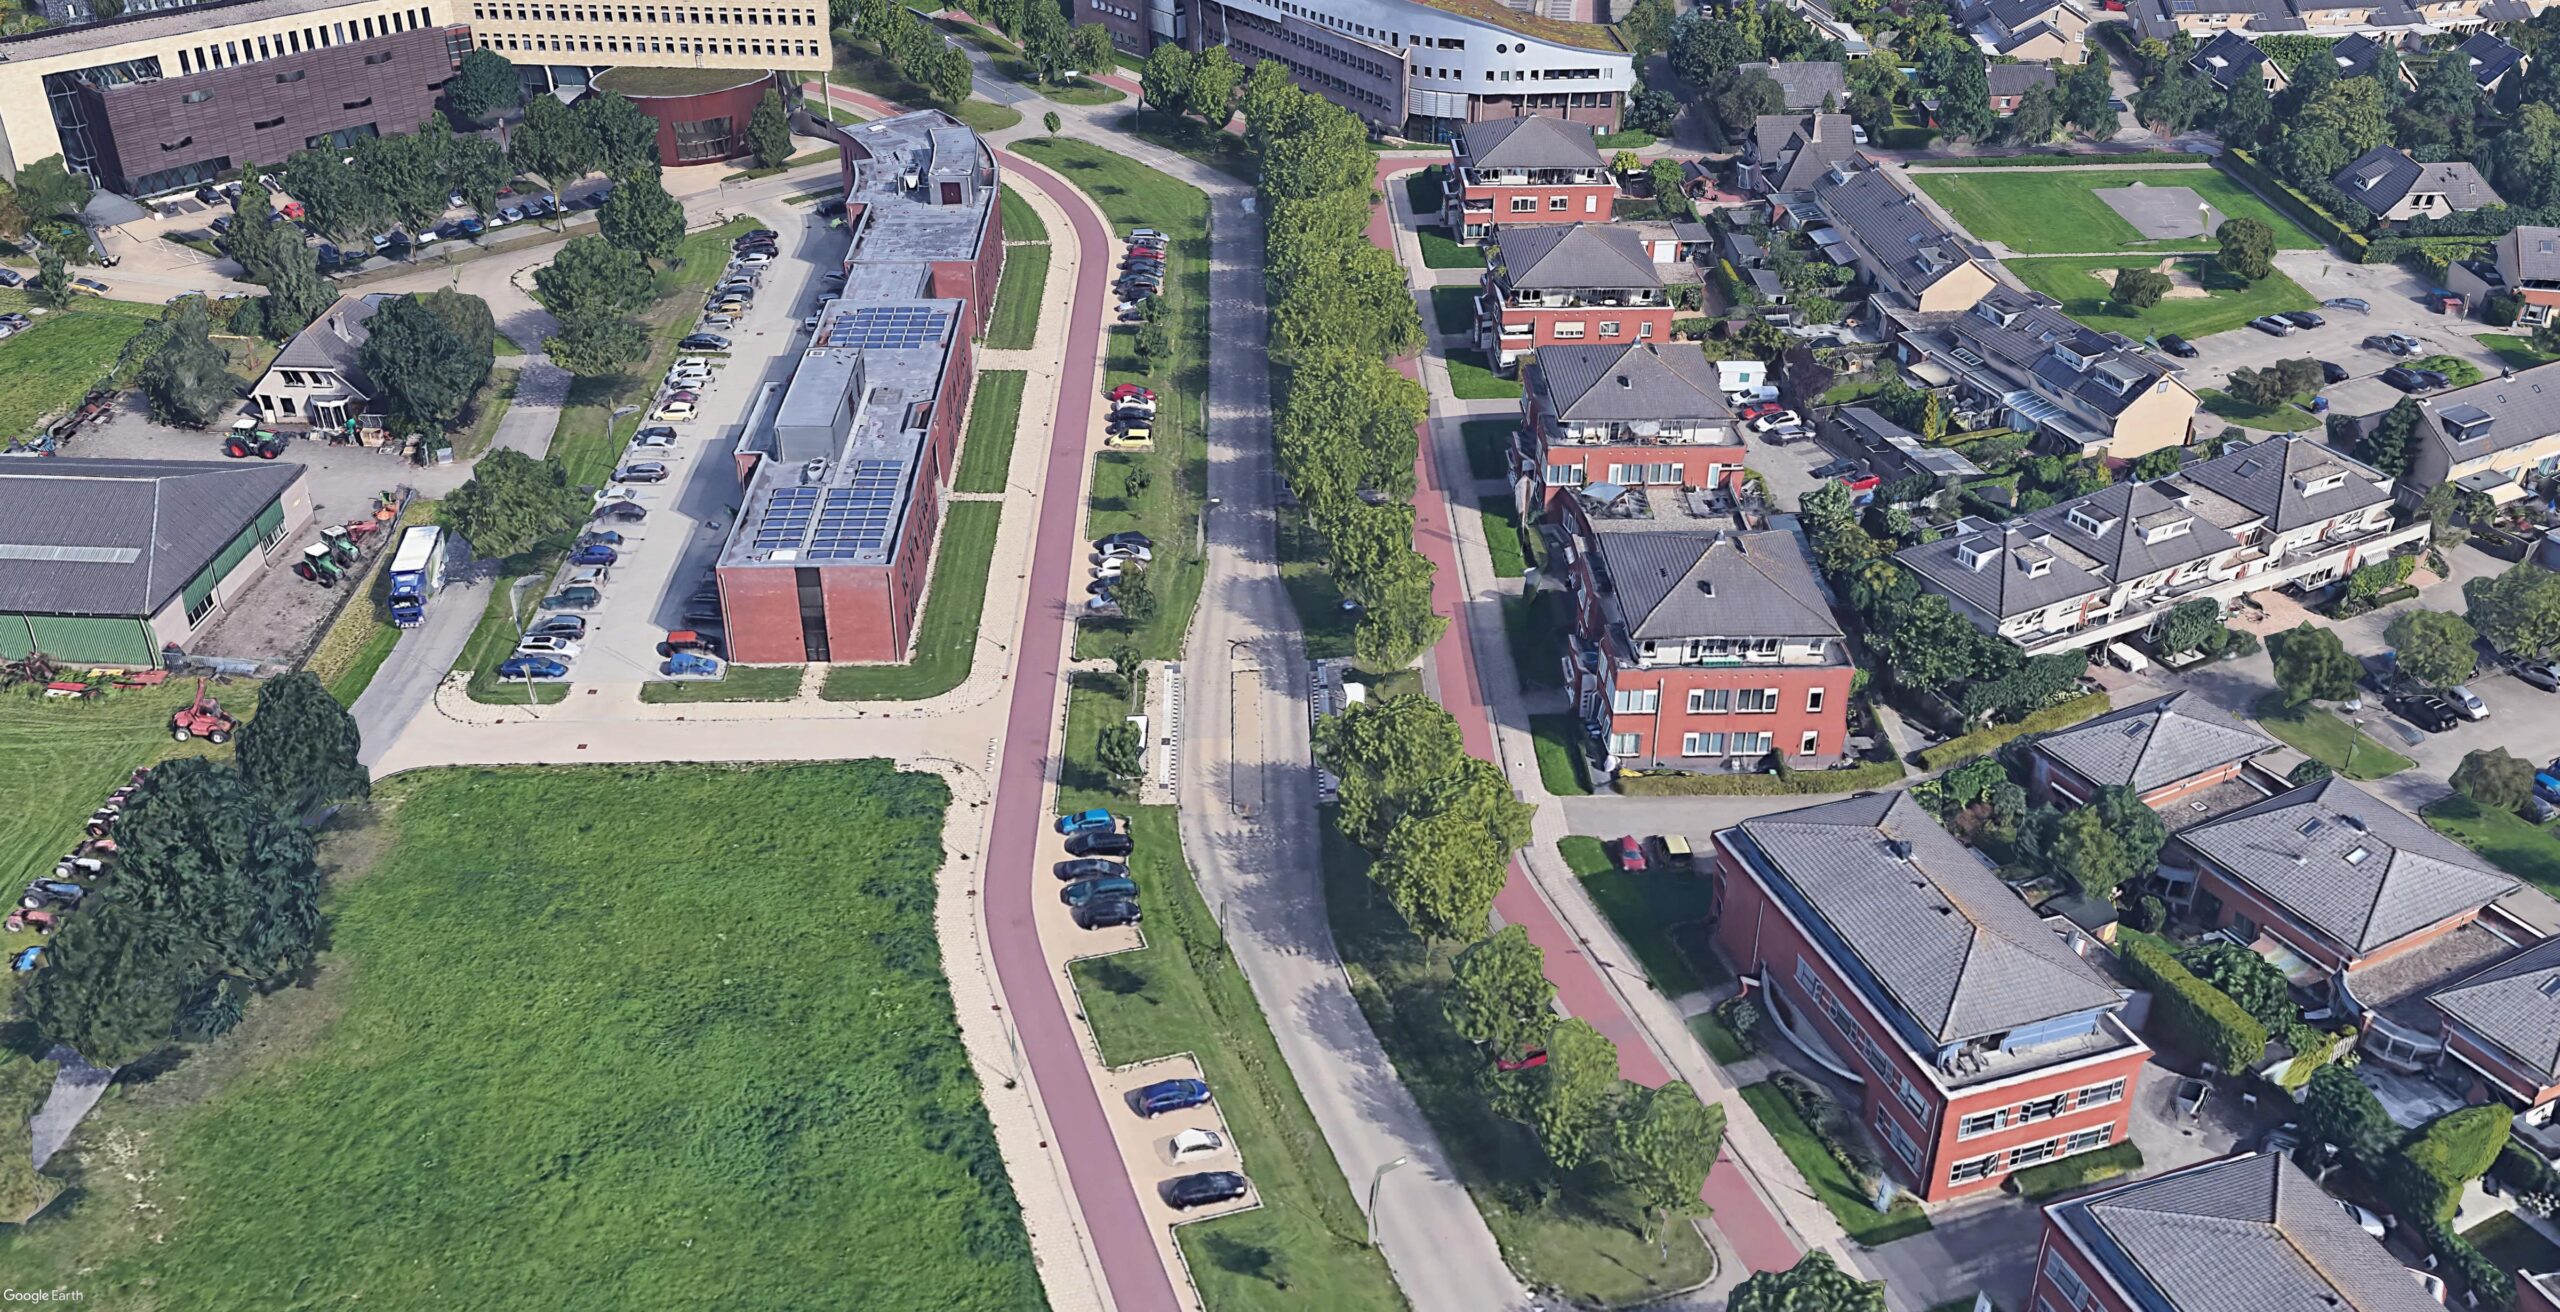
• Cycling street/access roads (20 km/h). It can be a service road.
When calculating the emission factors of the different modes of transport considered, we will use those that best characterise the modes used in the study area. The following can be taken as a basis:
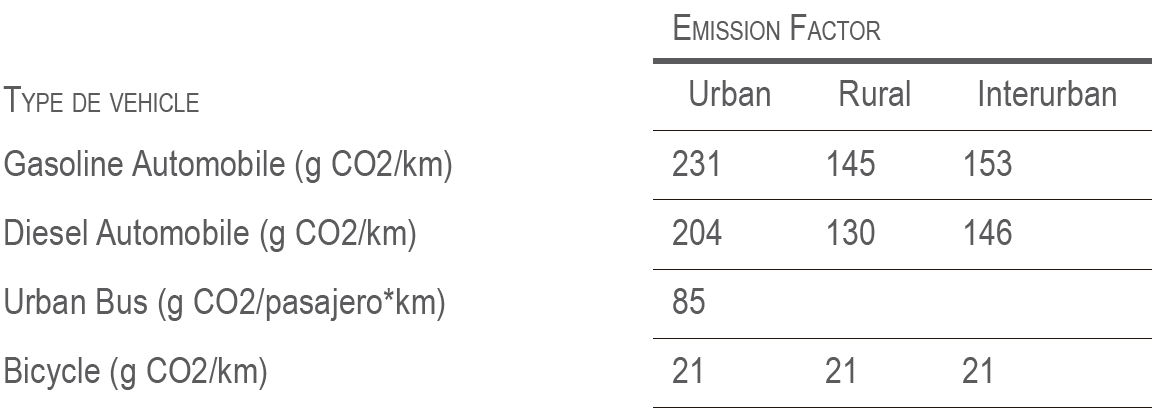 You can find more recent data here: The climate change mitigation effects of daily active travel in cities – ScienceDirect
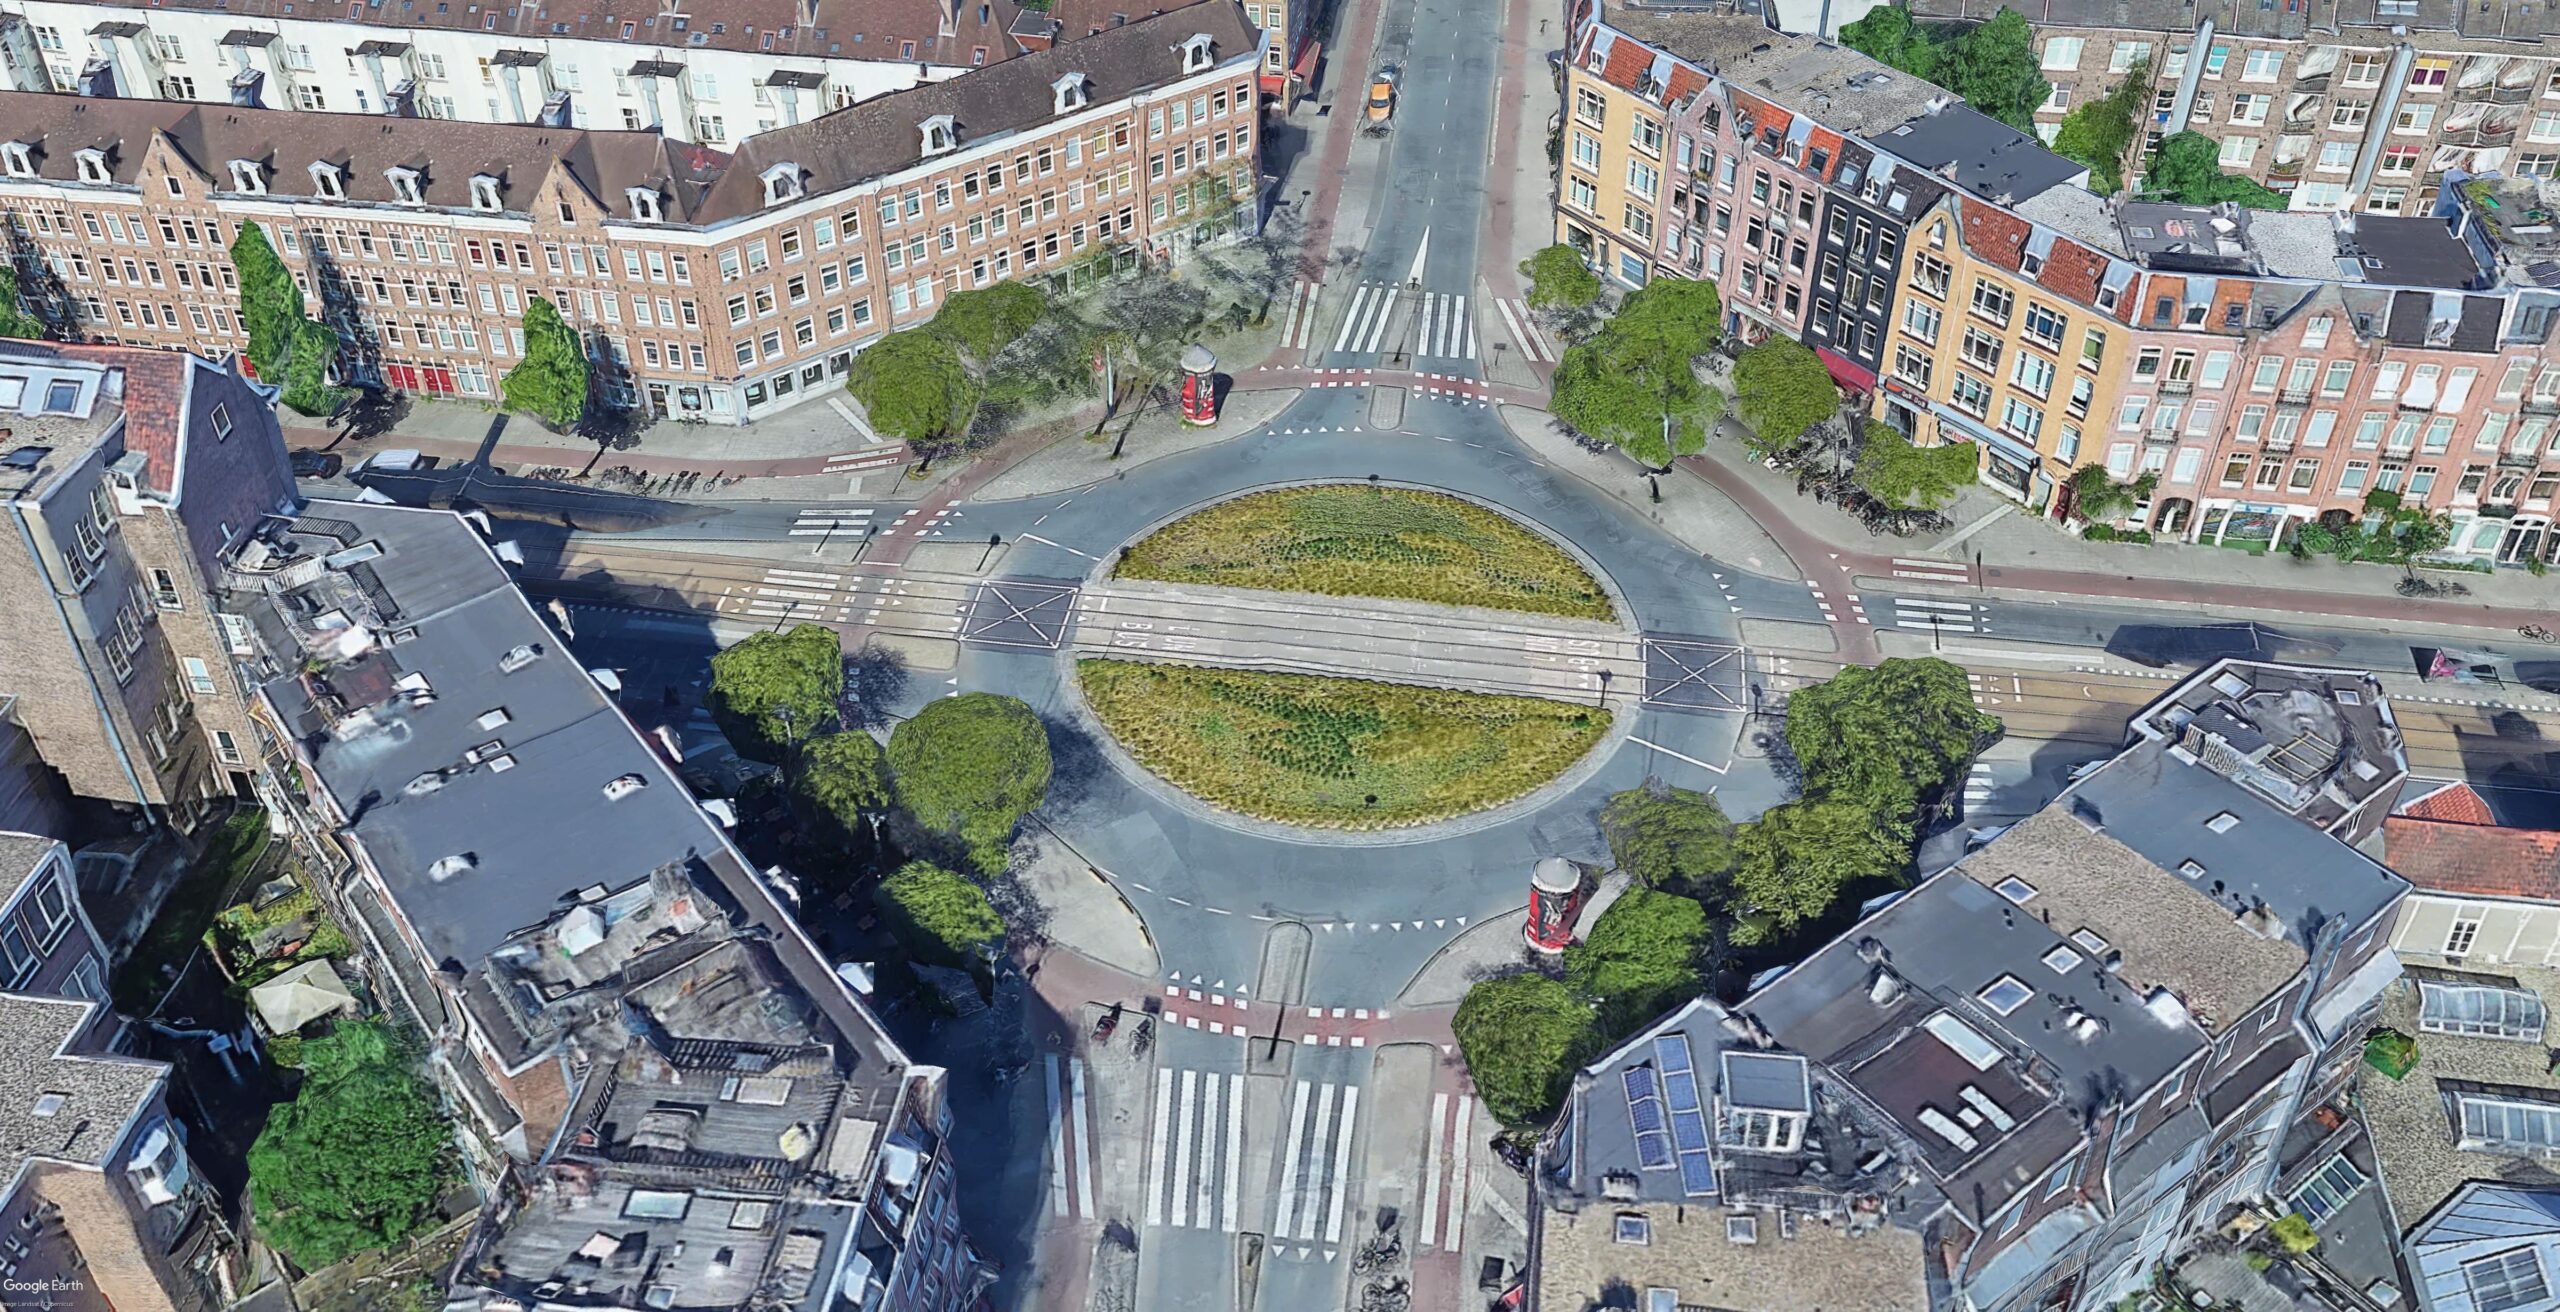
Level cycle paths in a roundabout (Amsterdam, Netherlands) (Source: Google)
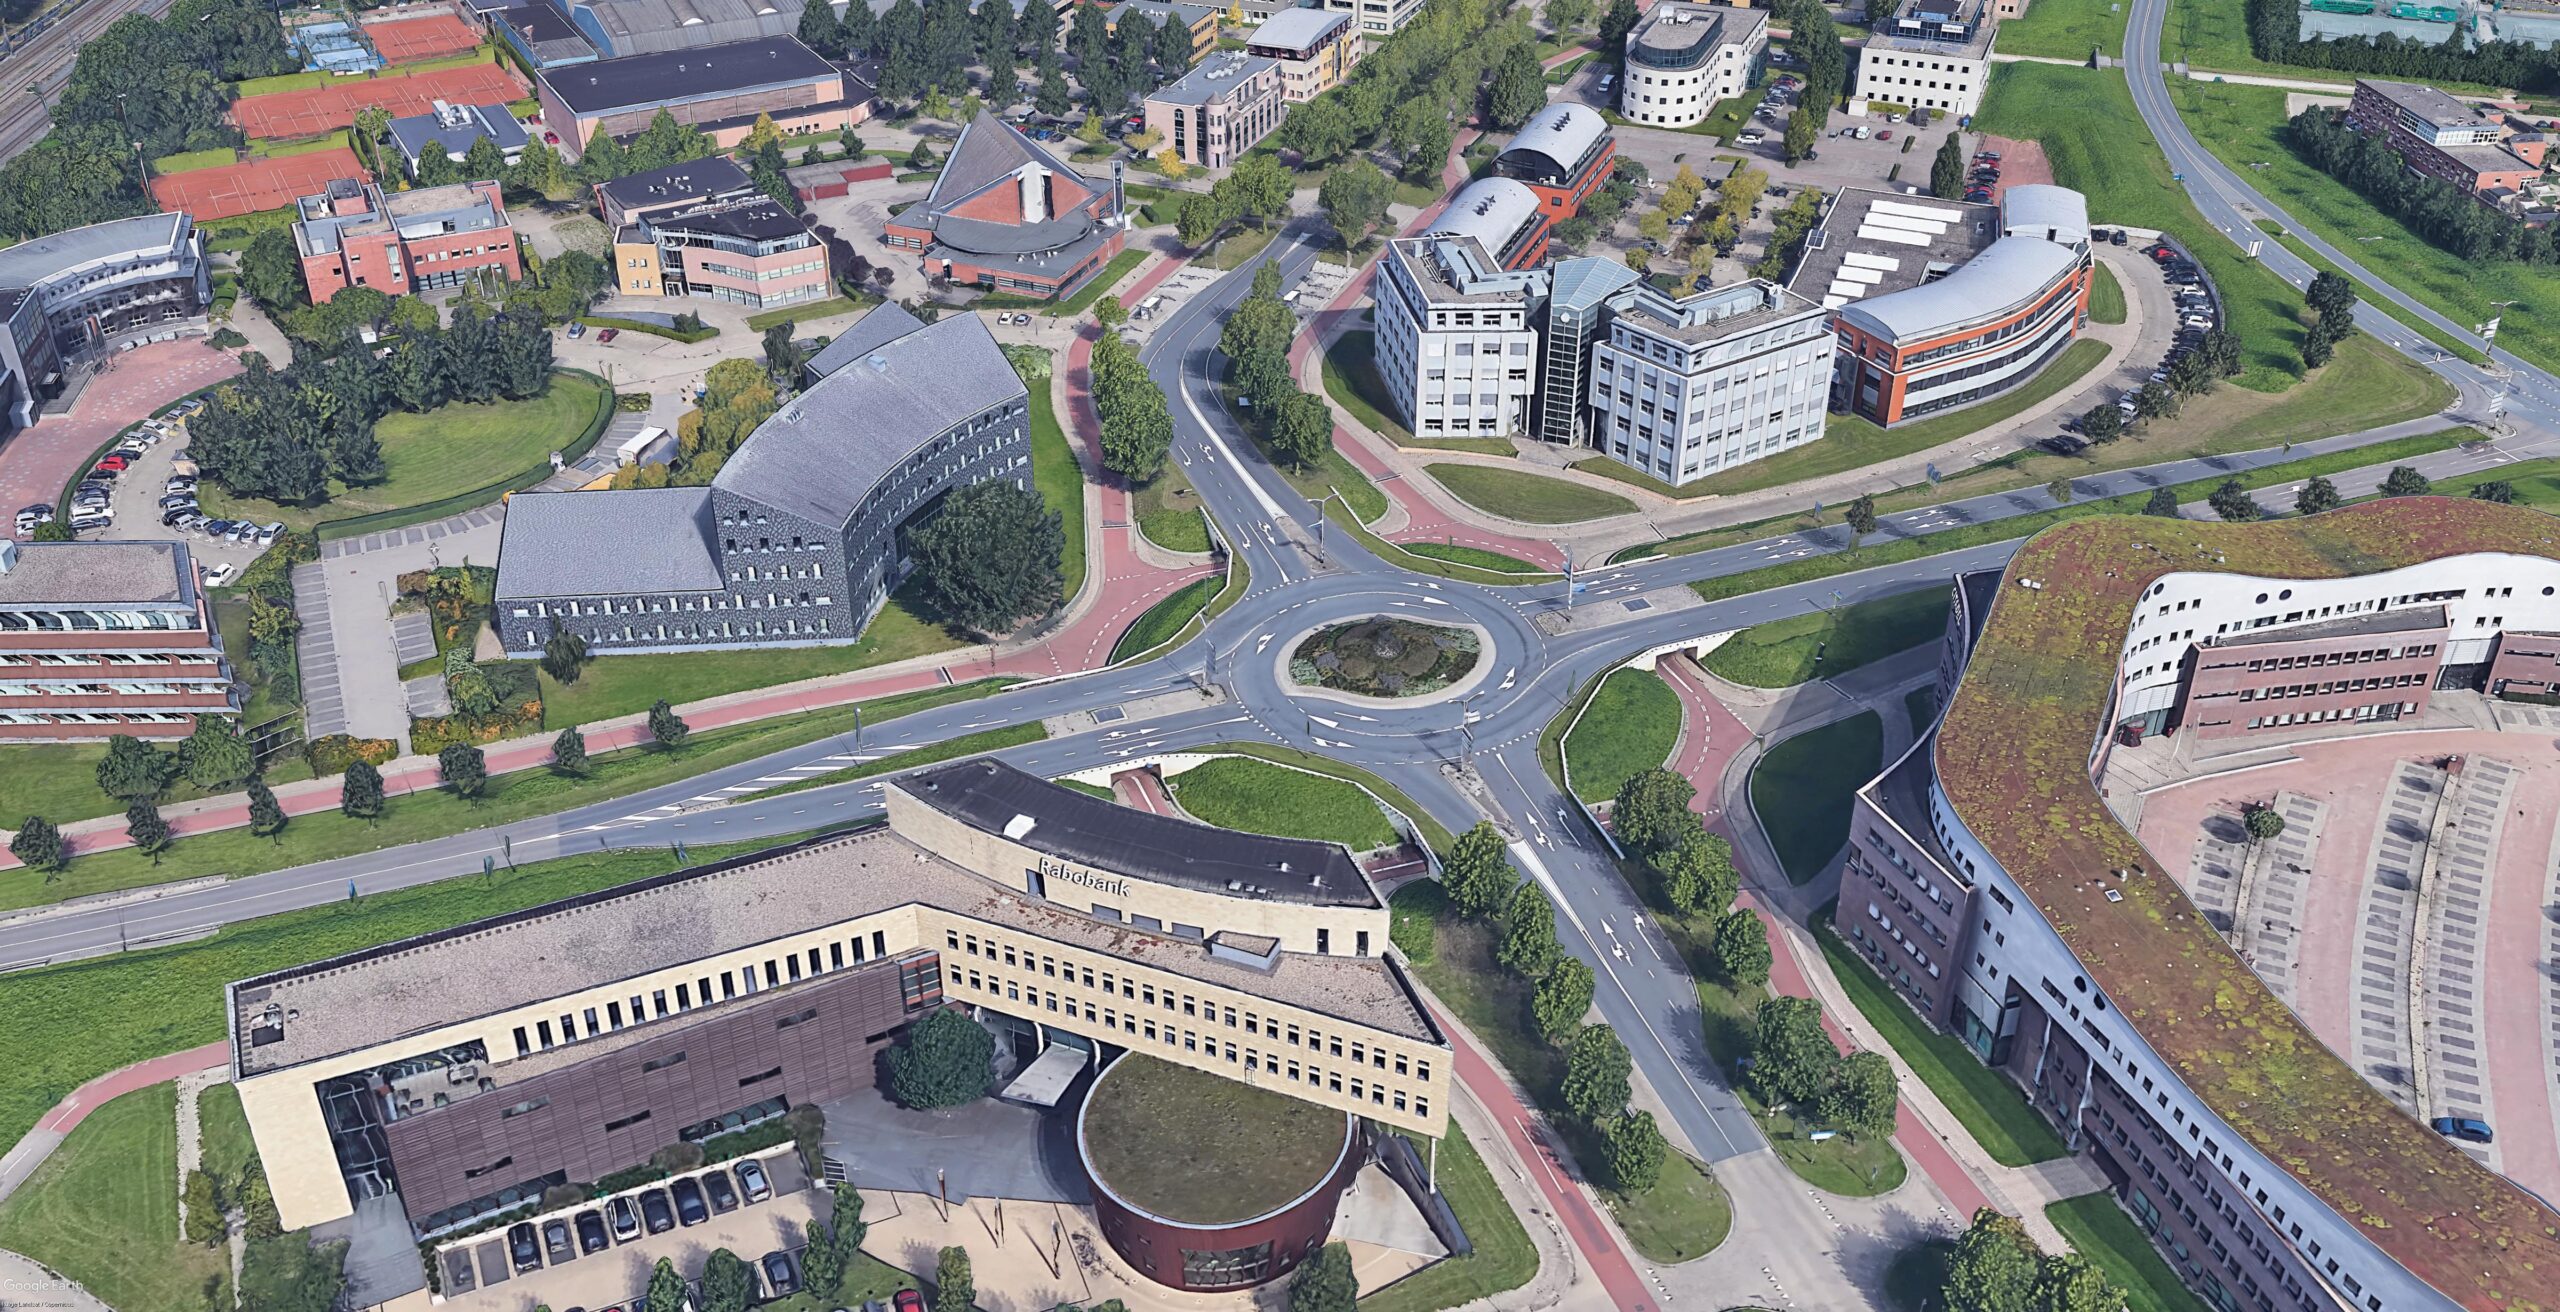
Cycle paths at different level in a roundabout (Houten, Netherlands) (Source: Google)
Cycling streets as service streets (Houten, Netherlands) (Source: Google)
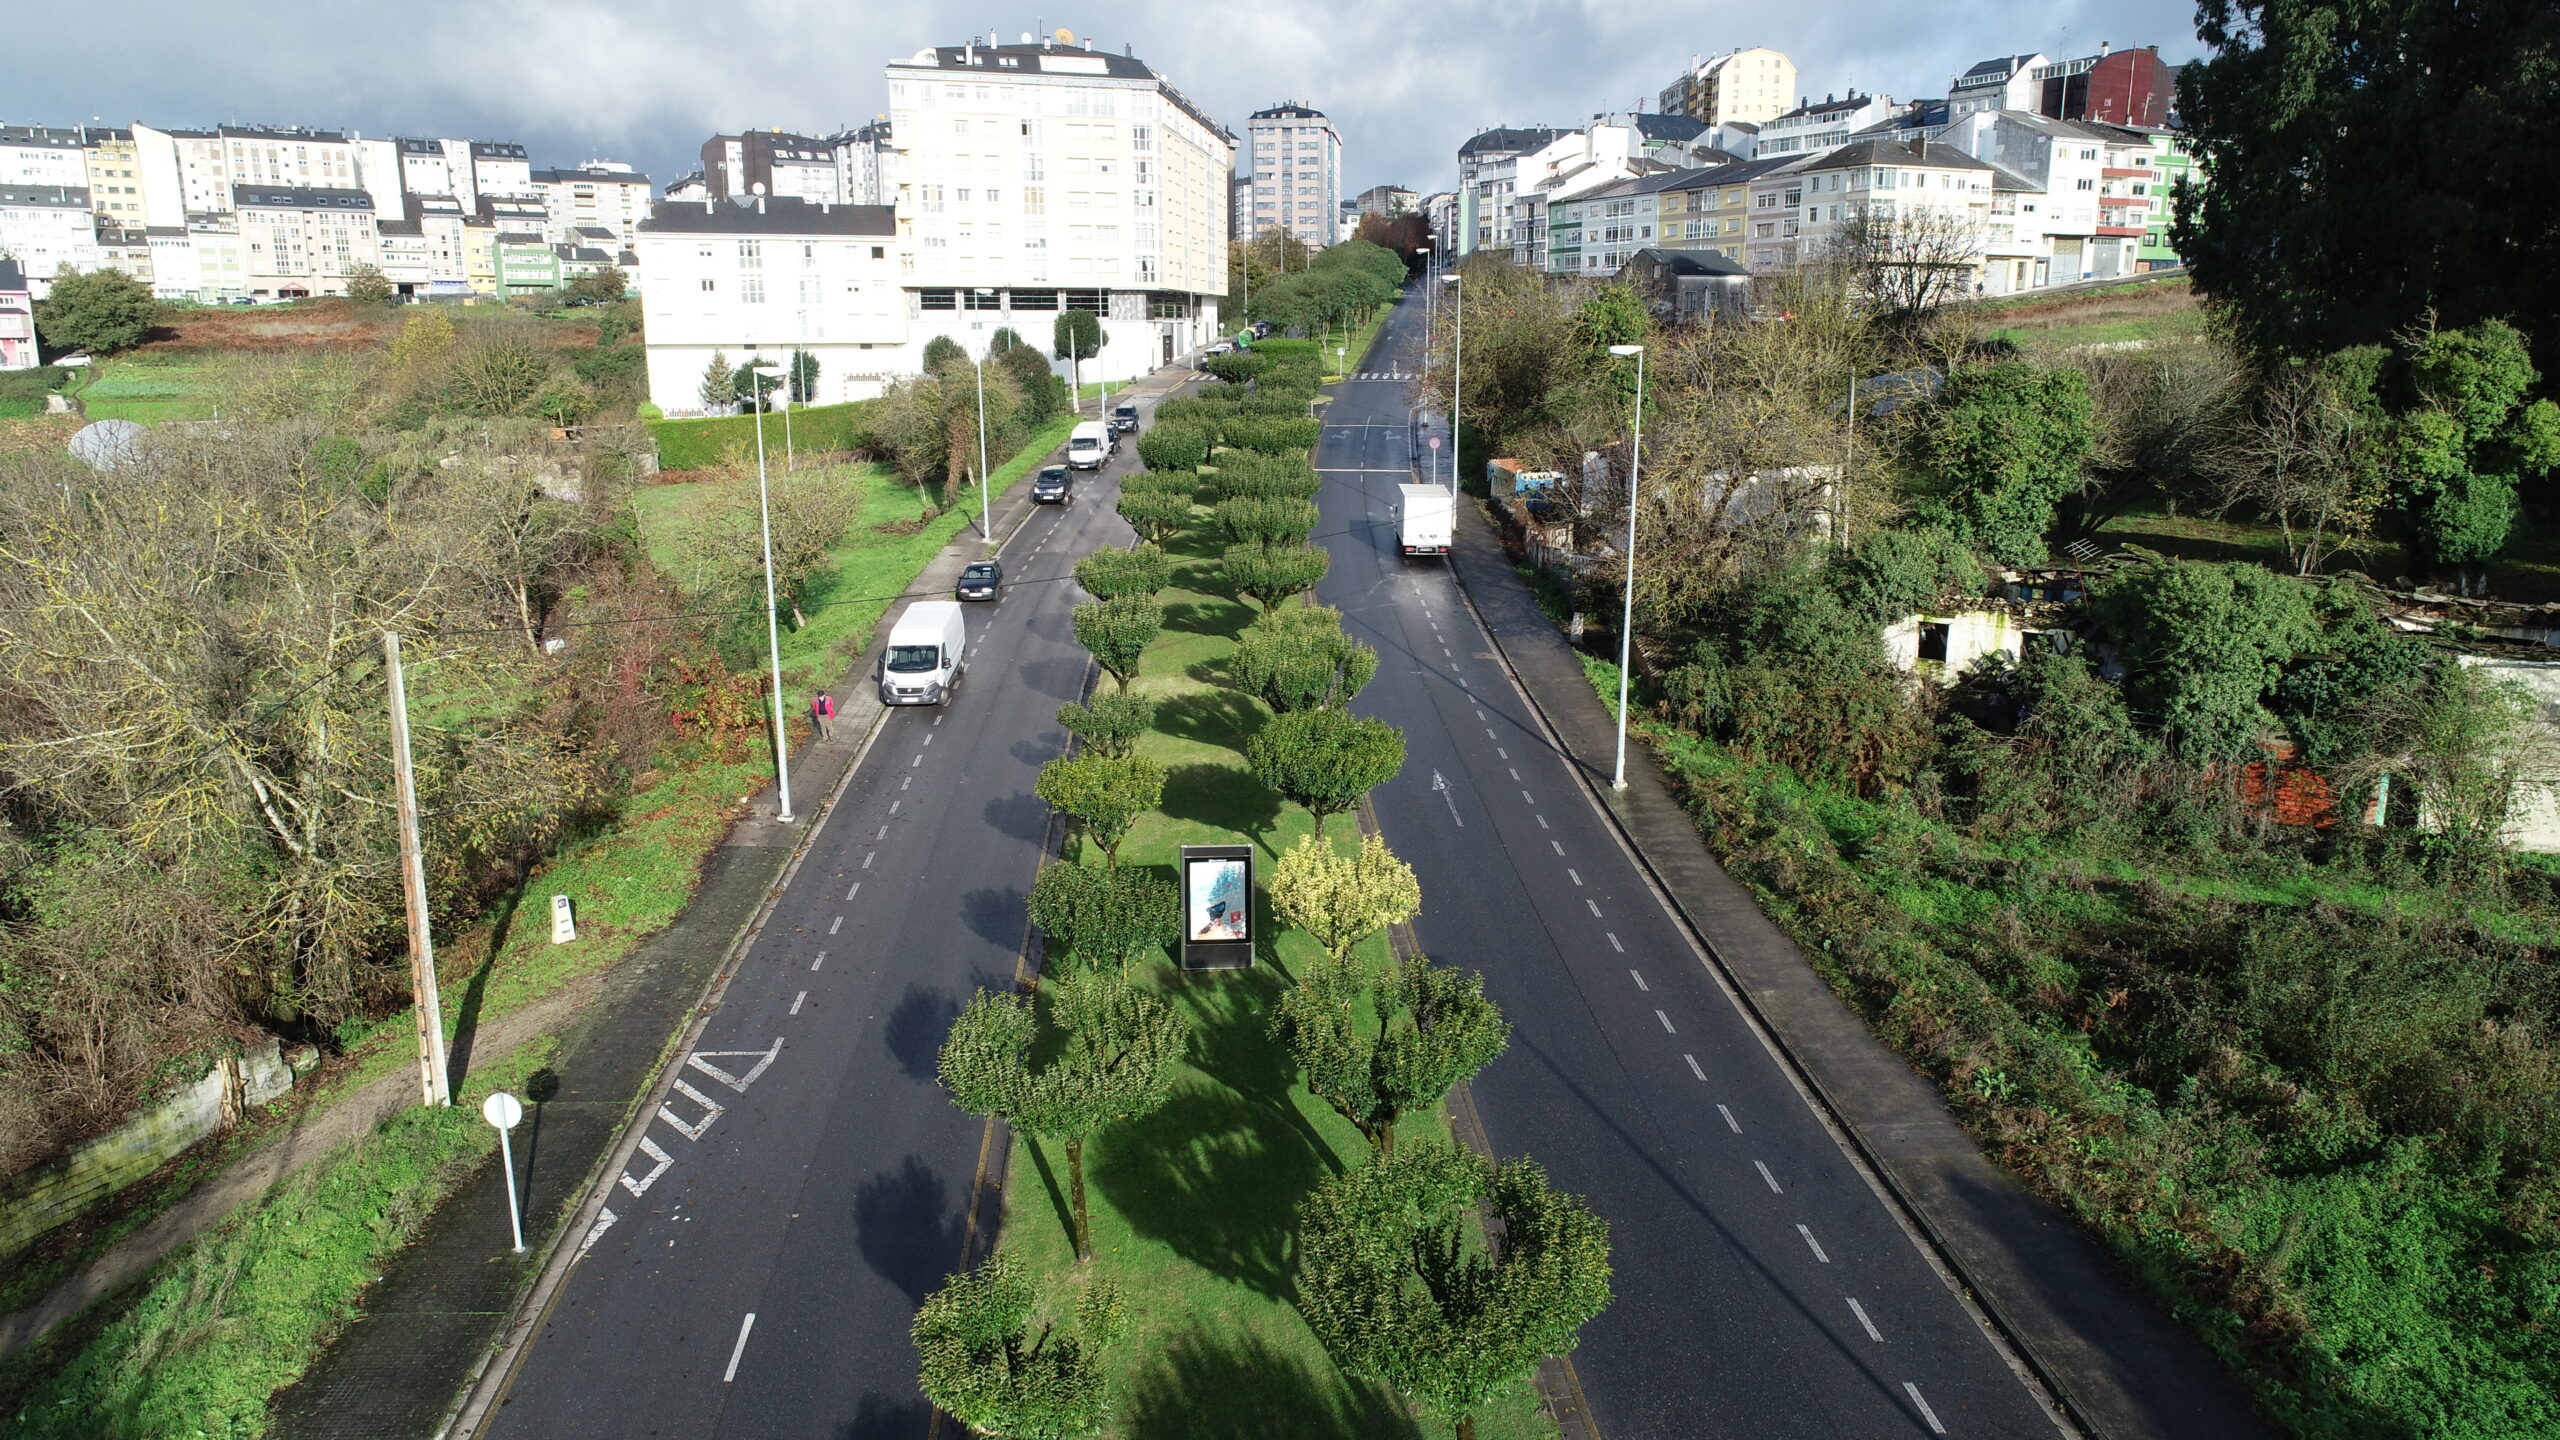
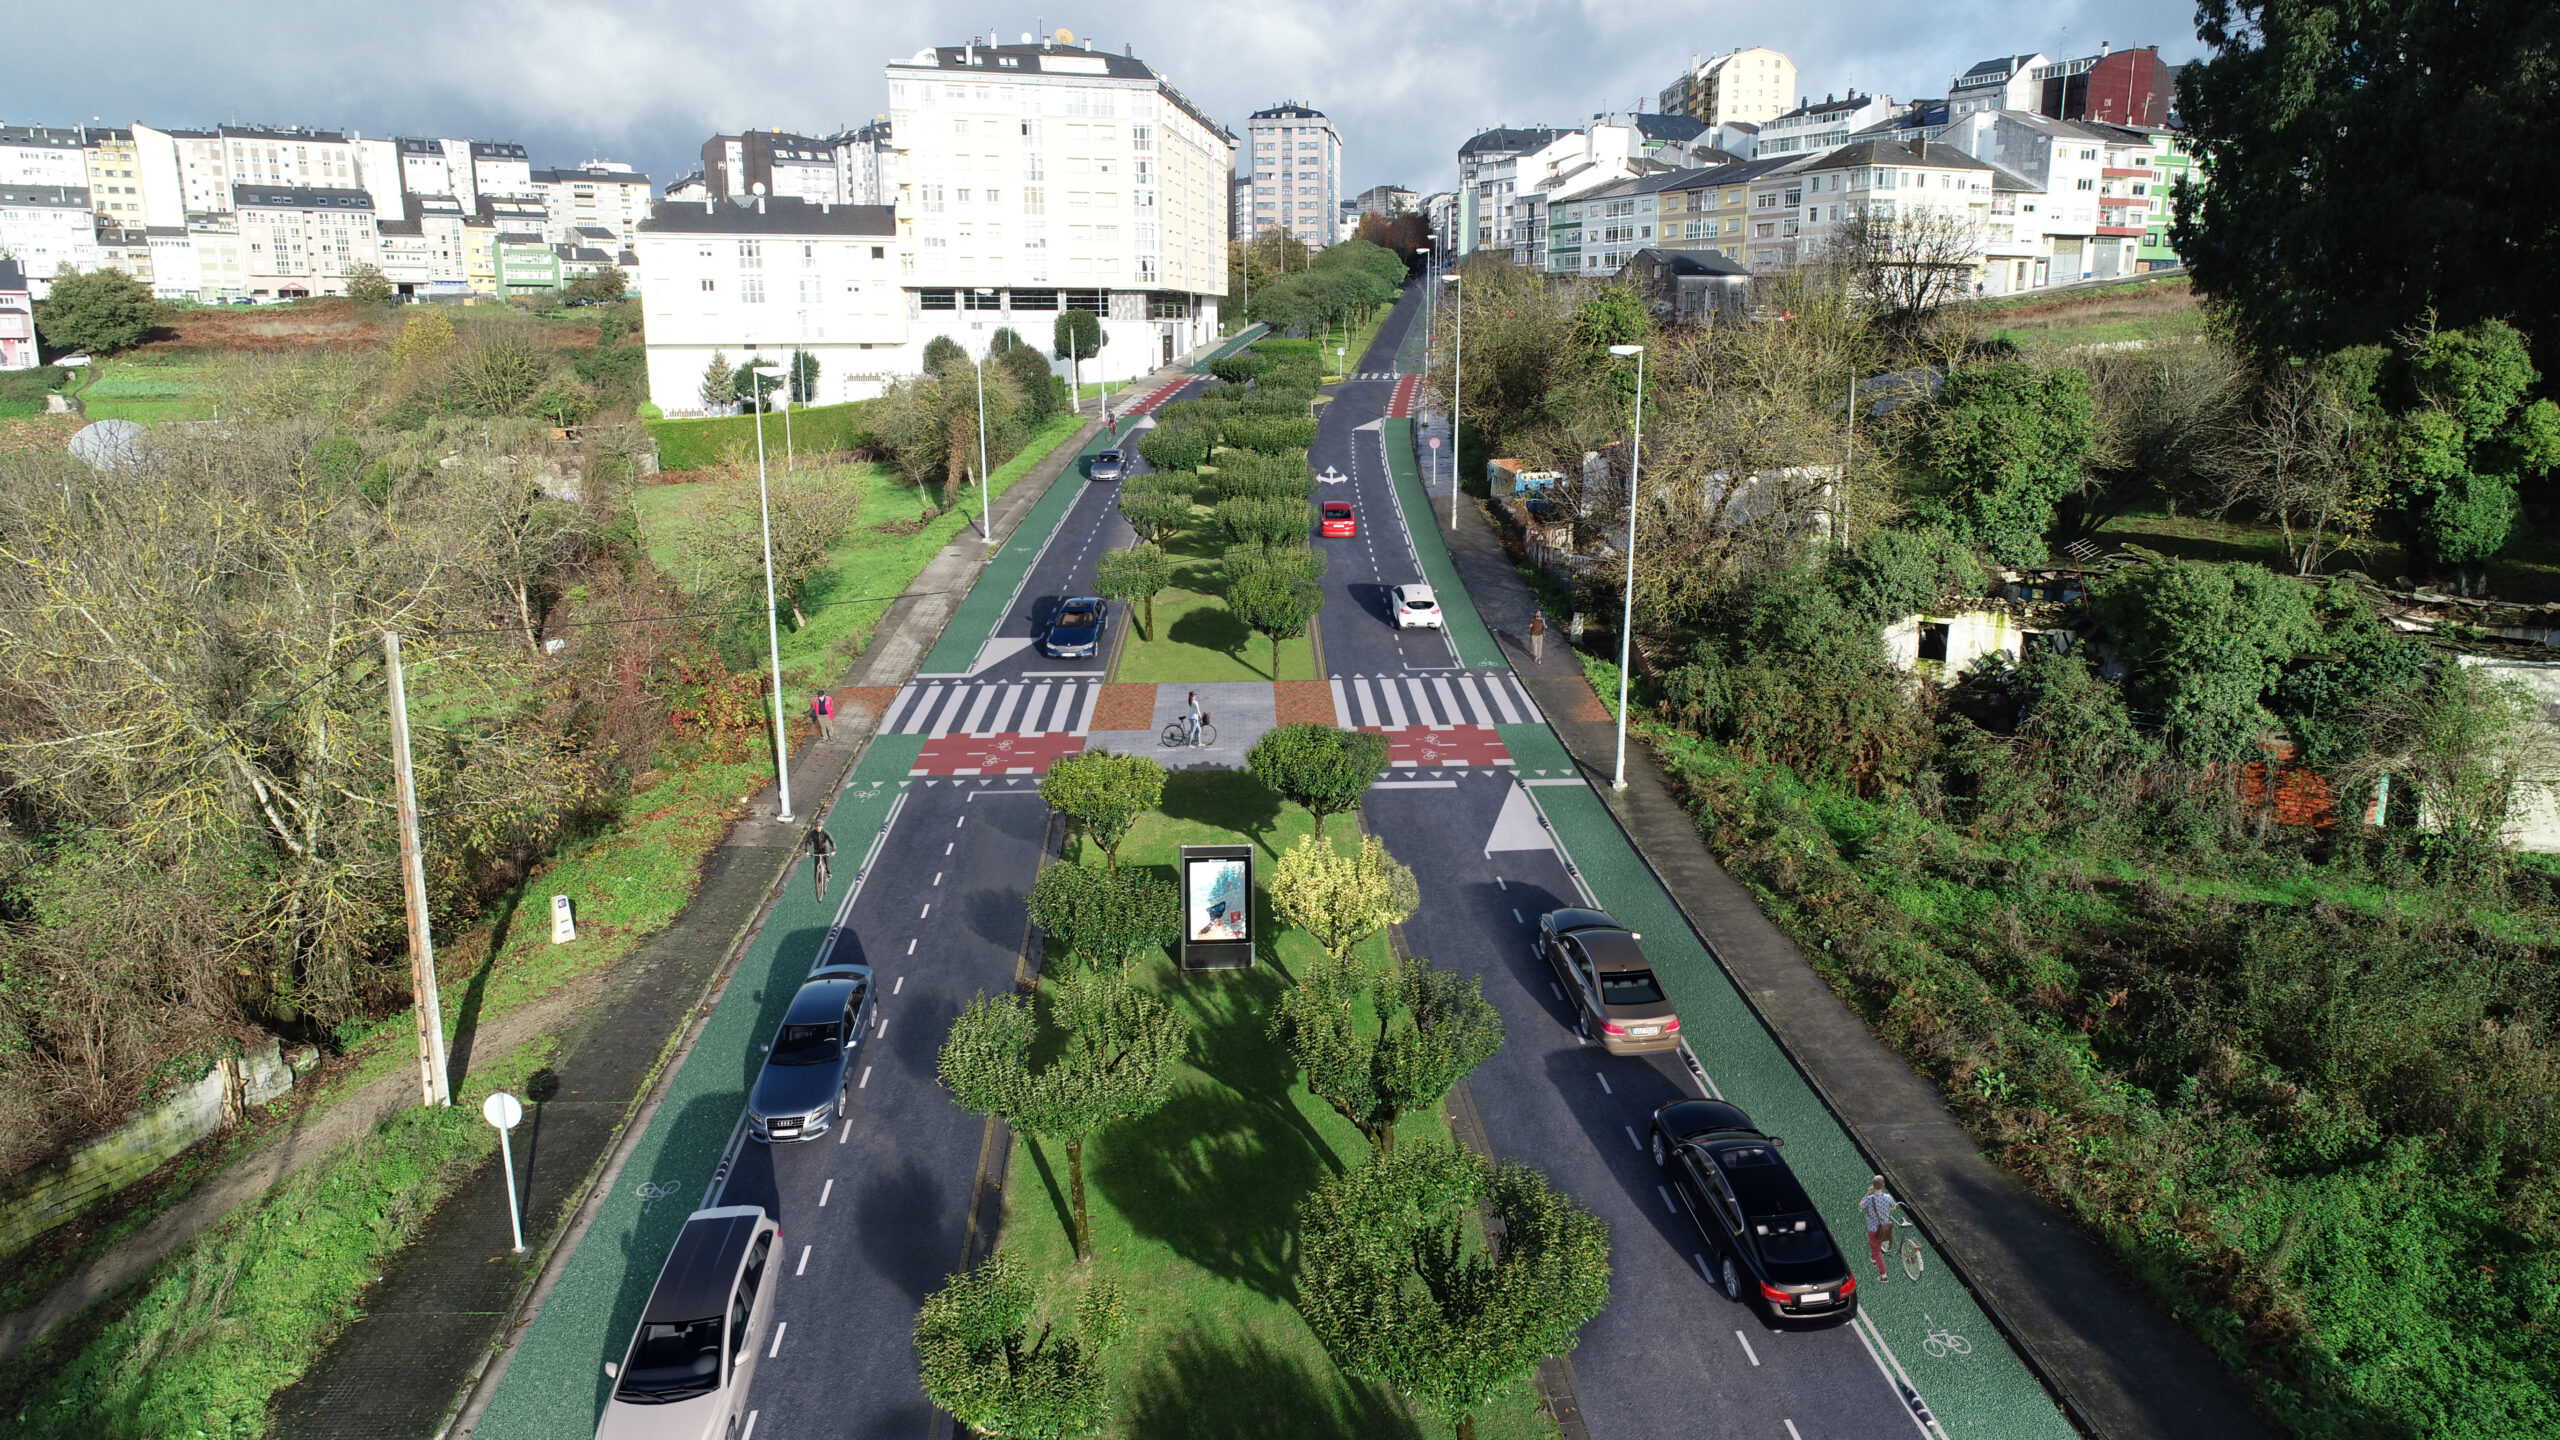
Example in which a lane is replaced by a separate cycle path
City Scale Intervention

ISSUES AFFECTED
SUITABLE FOR COMBINING WITH OTHER SOLUTIONS
Measuring elements
Indicator
Main: CO2 reduction by switching from private vehicle to bike trips
Secondary: % of trips from PV to bicycle
Unit
g CO2
%
Minimum Goal
2 % of trips from PV to bicycle
Desirable Goal
6 % of trips from PV to bicycle
Measure method / Formula
Anual Mobility Survey
∆g CO2=A x [B – C] x D
A: % of trips from PV to bicycle
B: PV CO2 Emission Factor (g CO2/km)
C: Bike CO2 Emission Factor (g CO2/km)
D: Total km travelled
The formula may vary depending on available data.
PLANNING LEVEL
General Planning
Development Planning
Urbanization Detailed Design
PEOPLE INVOLVED
Local Officials
State/regional government officials
Planning and design team
POSIBLE ACTIONS DEVELOPED BY THE ADMINISTRATION:
∙ To change municipal fleet vehicles for bicycles
∙ Create a police force that patrols on bicycles
WHAT SHOULD BE CONSIDERED FOR ITS IMPLEMENTATION?
∙ Complete itineraries should always be considered, and not stretches
∙ Special consideration will be given to the design of intersections
∙ The maintenance of cycle paths must have the same or higher priority than that of roads for motor vehicles
EXAMPLES
Actions within the DUSI strategy in Lugo consisting of reserving space for cycle paths, reducing the space for motor vehicles.


